We’re thrilled to share that YOTTAA’s 2024 eCommerce Tech Buyer’s Guide is out today.
YOTTAA publishes the eCommerce Tech Buyer’s Guide Index every year to give brands and merchants an objective view on the impact that third party technologies have on their site speed and performance.
In this blog we’ll explain the data methodology and highlight some key takeaways. But we only scratch the surface of the insights you’ll find in the full report.
YOTTAA’s 2024 eCommerce Tech Buyer’s Guide: The Full PIR Index
Within the report, you’ll find a full index that benchmarks the performance of the third-party applications with the greatest adoption across the YOTTAA community of eCommerce websites.
We build this index every year to help our ecommerce community understand the impact that third-party applications have on their site speed and performance. Third-party applications are critical to the shopper experience, but they can also significantly weigh down your website if they are not optimized correctly.
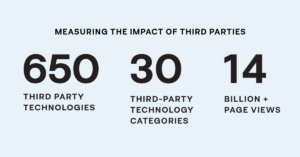
Within the report, over 600+ apps were analyzed and ranked with a PIR. The PIR or Performance Impact Ranking is a proprietary metric we use to benchmark applications against each other.

Which third-party applications have the biggest impact on site speed and conversion? You can download the free report to find out.
Get your copy of the 2024 Buyers’ Guide
Three Key Takeaways from YOTTAA’s 2024 eCommerce Tech Buyer’s Guide Index
Having measured the PIR of all 650+ third-party applications and compared the data to our previous reports, YOTTAA has been able to identify critical trends about ecommerce site performance.
Here are three key takeaways from the report:
1- eCommerce Tech stack consolidation did not materialize as expected.
Despite market discussions of tech stack consolidation, third party applications remained vital to the ecommerce experience. 39% of ecomm sites have the same or more third-party technologies this year. As Rick Kenny, Principal of Leading Lights and contributing author of the buyers guide put it, “Shouts for consolidation of the technology stack rang through the eCommerce ecosystem in 2023. But the purge never materialized.”
2- Third-party performance is improving, but there’s still work to be done.
Third party technologies are a critical element of the eCommerce stack and our data shows their technology continues to mature. They are improving their performance and minimizing their negative impact on the site experience.
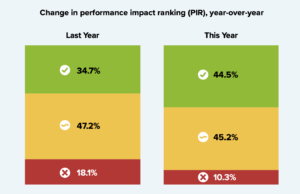
This chart shows the change in PIR* rankings from 2023 to 2024.

(as we noted earlier in the post, the PIR or Performance Impact Ranking is a proprietary metric we use to benchmark applications against each other).
More “green” applications and fewer “red” applications shows the slow and steady maturity of these critical technologies. But over 55% are still in the “yellow/red” – meaning they have significant impact on website speed – including Google’s Core Web Vitals.
3- 75% (3 of 4) of ecomm sites are not meeting Google’s LCP Standard.
This guide brings into focus the material impact that third parties have on Google’s widely adopted Core Web Vital metric, LCP or Largest Contentful Paint. Our data shows only 1 in 4 sites are meeting Google’s benchmark for ‘Good’ Largest Contentful Paint performance. The impact that each third-party has on LCP varies, and we review that specific impact within the report.
As ecommerce teams are pushed harder and harder to pass all of Google’s Core Web Vitals, their third-party tech stack needs to be examined and optimized.
Download the 2024 Report For Free
As the leader in the optimization of third-party technology for eCommerce, our mission with this annual report is to give eComm brands and merchants an objective view on the impact that third party technologies have on their ecommerce websites.
These three takeaways only scratch the surface of the critical data included in this report.
Download the full analysis today to view the impact your third-party applications are having on your site performance.

