What Performance Impact Ranking Means, and How to Evaluate Your Third-Party Apps
Third-party technologies are central to the eCommerce tech stack because they add critical elements to the online shopping experience. Every year, YOTTAA analyzes the third-party applications landscape and shares our findings with the market in our Annual eCommerce Tech Buyers Guide.
Our goal in publishing this report every year is to help eCommerce leaders view their third-party application performance and impact with an objective lens. You can find the full report here – with analysis of over 650 ecommerce websites and their third-party applications. In this blog post, we’ll highlight some key trends about the third-party landscape, and analyze the impact of some specific applications – ones you may have running on your site.
Third-Party Adoption is Increasing
YOTTAA’s analysis shows that the third-party tech stack is expanding. Despite some market expectations of consolidation, 39% of sites have the same or more third-party technologies in their tech stack compared with a year ago.
These apps are present throughout the entire shopping experience, not just concentrated on one area of the site. While brands had the most third-party applications running on product detail pages – 51 on average – category pages and home pages host weren’t far behind with an average of 49 and 46 applications per page respectively.
Brands sites are more reliant than ever on third-party applications to drive site performance and conversions. So understanding this, our next step was to benchmark all these apps against each other to gauge their impact on the shopper’s experience.
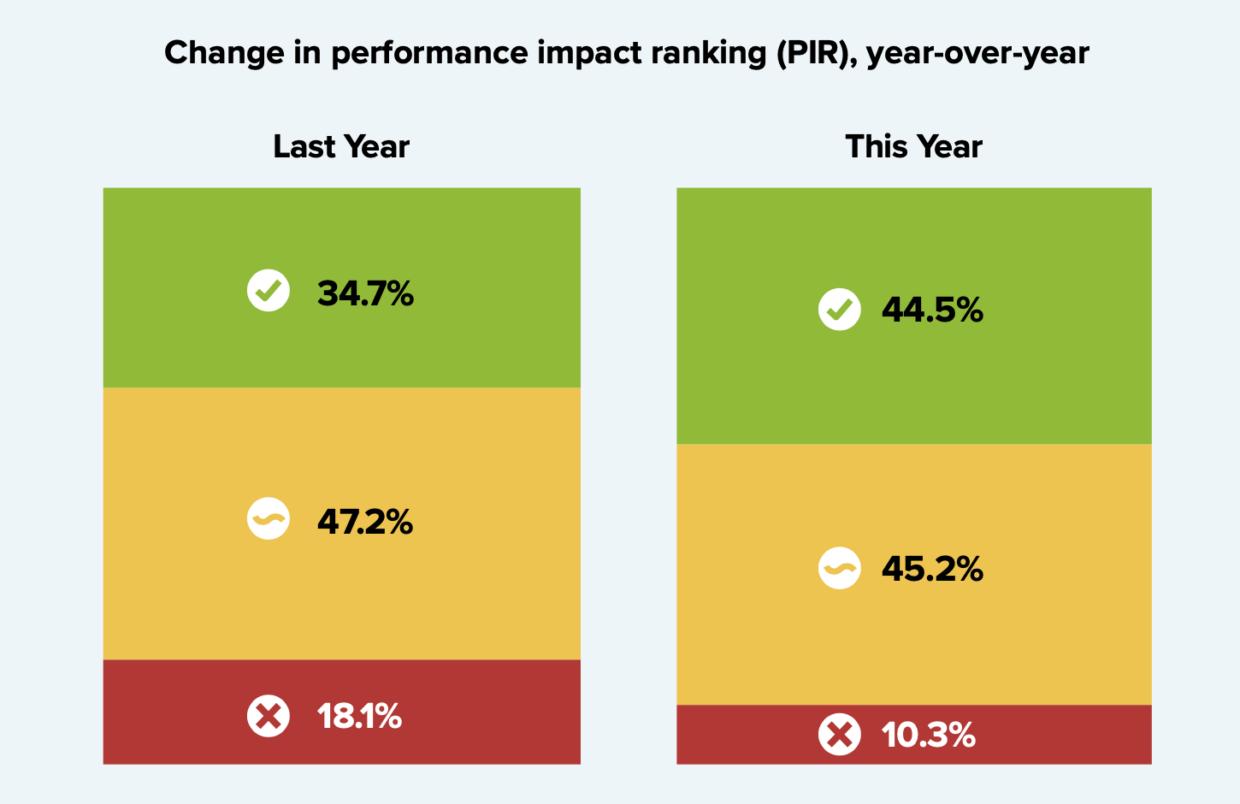
Benchmarking Third-Party Apps with A PIR Score
Within the report, we assigned over 600+ apps with our proprietary metric called the PIR or Performance Impact Ranking. The PIR is calculated by adding the total page delay violations and performance risk violations caused by the third-party, then dividing that number by the total number of resources loaded by the third-party.
The PIR scores are grouped on a scale of green, yellow and red. Green represents little to no performance impact, and Red represents a ‘consistent negative impact on performance’.
We provide a full index that benchmarks over 650 third-party applications as Green, Yellow or Red PIRs, so you can look granularly at the performance of just the tech stack you use. But we also analyzed some trends of this PIR data – here are some highlights.
Ranking Third-Party Applications – Yottaa’s 2024 Key Findings
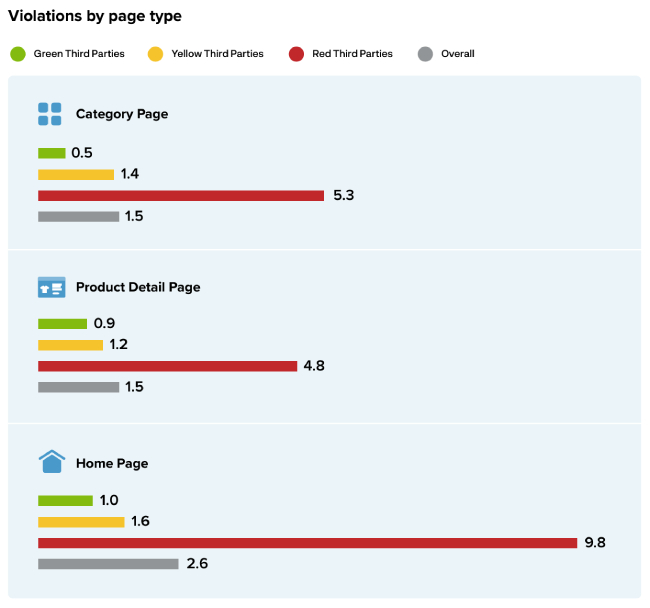
- Negative PIR Scores Cause 10x Delay Violations on Home Pages
Shoppers are interacting with third parties from the moment they arrive on your site to when they complete their purchase. As such, our data shows third-party applications with negative PIR scores have a sizeable impact across home pages, product category pages, and product detail pages. But the worst offenders by far are those that live on home pages. The chart below shows the impact that a third-party application with red PIR score can have on the number of page delay violations that happen on an eCommerce home page. Yottaa saw nearly 10x page delay violations occurring on home pages that had third parties with a red PIR ranking.
- PIR Scores Correlate Directly to Your Site’s LCP Ranking
With sites carrying 51 third-party technologies on average, the page performance impact contributed by third parties adds up quickly. We looked at this impact through the lens of Google’s speed performance standard of LCP, or largest contentful paint.
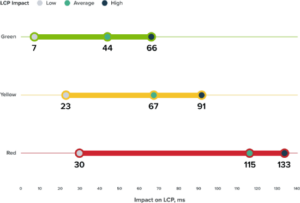
On average, third parties that earned ‘Green’ PIR scores have a near-negligible effect on LCP time. But apps that scored Red average 115ms of impact on a pages LCP time - New Applications Have Better PIRs
We’ve been running this report for over 5 years, so we’re able to look through a historical lens and evaluate brand new apps as their own cohort. Third parties that were new to our ranking system this year avoided the red ranking almost unanimously, most ranking as green. This is a great signal of market maturation – third parties are getting better and mitigating their impact on page performance - The Third-Party Categories of Image Hosting, CMS and Commerce Search Are the Worst PIR Offenders
When looking at the PIRs by third-party types, we identified some categories with the biggest impact on your site. The category of third-party applications with the worst average PIR rankings were image hosting, CMS, and Commerce Search applications. If you have these applications live on your site, they’re a good place to start your evaluation – as they have a good chance of having a less-than-ideal PIR number.
Are Your Third-Party Applications Hurting eCommerce Sales?
The Performance Impact Ranking (PIR) of the third-party applications that are active on your ecommerce site can have a material impact on your ecommerce site’s performance, including LCP ranking and count of page delay violations.
We advise eCommerce teams looking to increase conversions to leverage this buyers’ guide to take a critical look at the applications they’ve deployed across their many site pages.
This doesn’t mean you need to abandon your tech stack and get it all from the Red to the Green. Tools like Yottaa were built to improve how these applications work together, making a huge difference in your site load times and ultimately, your sales.
Download the free report to read our full analysis, and research the PIRs of over 650 applications, to understand where your site stacks up.