With the arrival of the all-new Site Speed Standard benchmark data, available on the eCommerce Speed Hub, online retail brands now know definitively that site speed is critical to conversion. The data shows that optimization is key to shopping session performance, the buyer journey, and page performance – 3 key eCommerce elements that can make or break a brand’s bottom line.
Buy, Browse, or Bounce
Every eCommerce shopping session leads to an outcome. Shoppers either buy something, browse a product line, or bounce, often to a competitor’s site. The benchmark data on the Site Speed Standard proves that page load time has a direct impact on conversion and bounce rates, and also reveals what happens as page load times increase.
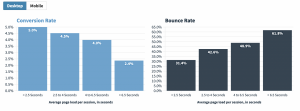
The graph below illustrates that faster load times convert much better than their slower counterparts. You can see that the conversion rates of sites with speeds up to 2.5 seconds are double anything over 6.5 seconds. A similar trend happens with bounce rate, which is halved with the fastest site speeds.
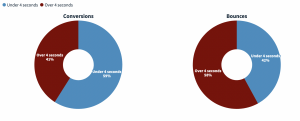
The Site Speed Standard benchmark data found that most of the conversion (59%) occurs when brands beat 4 seconds for page load times. When pages take over 4 seconds to load, it delivers a near identical number of bounces (58%).
The Anatomy of the Buyer Journey
We now know that site speed is important to conversion, but does it matter which pages are the fastest? The graph below shows that buyers spend most of their time on the Product Detail and Category pages.
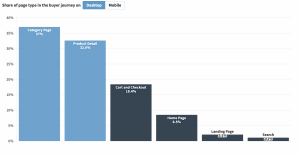
In fact, two-thirds of page views are happening there alone. When brands optimize these two pages, they will maximize their opportunity to connect their product line and the shopper.
Product description pages load 34% faster when optimized, which saves a full 2 seconds on desktop and 1.8 seconds on mobile devices. As we’ve already learned, faster page load means a higher conversion rate and less chance that a shopper will end up visiting the competition.
Optimization Delivers a 21% Faster Journey
The graph below tells us that when all pages viewed during the buyer journey are stacked together from beginning to end, optimization provides a 15 second time savings, which means a 21% faster buyer journey.

This time savings on optimized product detail and category pages earns brands 4 additional page views, meaning that shoppers see more products.
Page Performance vs. Buyer Experience
Site speed is obviously paramount when it comes to conversion, but eCommerce shoppers also expect a rich online retail environment; the online shopping experience is too important for brands to ignore. The 3rd parties that provide this positive experience cause slow site speed, but the Site Speed Standard benchmark data proves that optimization allows high resource sites and fast load times to coexist. The graph below illustrates how much of a difference optimization makes:
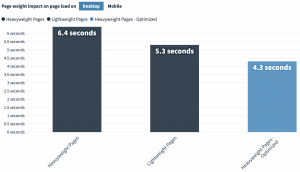
When high resource, or heavyweight sites, are optimized, they perform a full second better than their lightweight counterparts. The data proves that online brands can offer their customers engaging, feature-rich sites and great performance at the same time.

