Click Here to Read Part 1: Crash Course in SaaS App Web Performance Part #1: Monitoring Trending Data
In part #1, we covered the basics of collecting and analyzing trending data for the performance of SaaS applications. This involves setting up monitors for several pages within your SaaS app. The monitors collect data by regularly visiting the page as a logged-in user, with a variety of real browsers, connectivity types, and geographic locations. We looked at trending charts that show performance data over time for each page, segmented by time frame and by the variables we chose to monitor.
Knowing that these patterns occur is one thing; finding the causes behind them is another. To find out what’s going on inside your SaaS app to cause these patterns, you’ll need to look into individual samples.
Become familiar with the baseline
Before looking into performance outliers, it’s best to familiarize yourself with what “optimal” performance looks like. Choose a handful of samples from a page that shows fairly consistent performance, and perhaps a few of the faster samples from a more volatile page.
For each sample you choose to view, find the waterfall chart and other key data. In the waterfall chart, take note of what assets take the longest to download, and what types of assets (be they JavaScript, images, etc.) take longer than others generally. Look out for third-party assets that involve a lot of repetitive assets. Note the “time to last byte” (the very first line in the waterfall chart, barring any 301 redirects), which represents the delivery of the HTML file.
Keep in mind these are the “good” samples. You’re looking at your site at its best.
Now head for the problem areas
Choose samples from sudden spikes in load time, and samples from the generally slower pages.
First, look at the basic information about these “bad” samples:
- Do the samples come from certain locations?
- Do they come at a certain time of day or week?
- Do they correlate with times when your site is receiving the most traffic?
Next, check out the waterfall charts.
- Is one bad asset dragging the whole page down?
- Is there a sequence of assets that are uniformly slower?
- Is an asset served by a third-party domain blocking sequential requests from coming through?
- (read more about how to read a waterfall in our eBook, How to Find 10 Performance Problems in 10 Seconds)
Your findings may not reveal explicit patterns right away. Performance problems might crop up once and never again. This can make the process frustrating, especially for complex applications with many moving parts. But continuing to review samples and make notes of the performance issues will eventually net out the truly problematic assets.
Let’s look at some examples
These are examples that show how following the guidelines laid out above can yield crucial information on bottlenecks in SaaS performance. The best part: this analysis takes just a few minutes once monitors have been set up.
Example 1
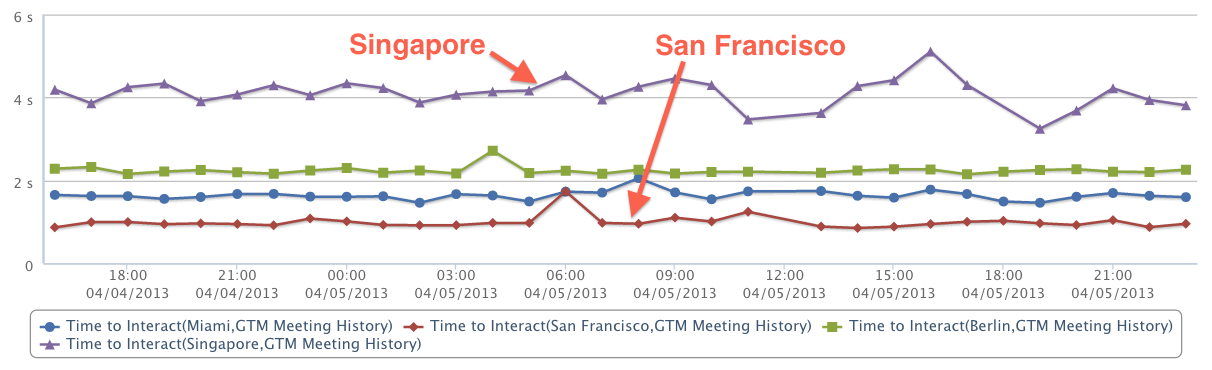
This trending graph shows hourly averages for the performance of the “Meeting History” page of the GoToMeeting app, segmented by individual test locations (Miami, San Francisco, Berlin, Singapore). Singapore clearly has the worst performance, while San Francisco has the best. Not only is Singapore by far the slowest, it’s also the least consistent.
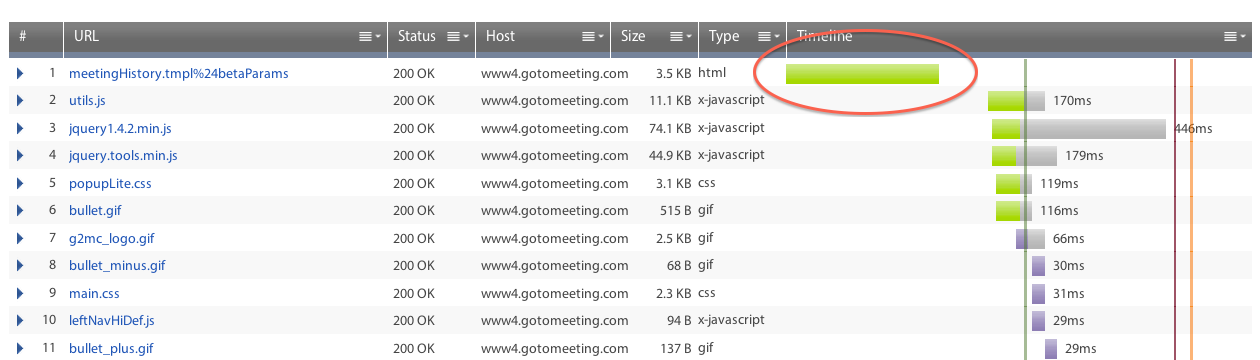
This waterfall chart is from one of the San Francisco samples. Note that delivery of the HTML file (the first green line) is one of the longer processes in the download, which would normally be a red flag when looking at a waterfall chart. Slow delivery is bad.
In this case, however, it’s actually more of a comment on how simple and unadorned the page is than how bad the delivery is. Outside of the SaaS world, typical web pages have tons of images and scripts that drag performance down, dwarfing delivery and their contribution to the overall page load time. The fact that a speedy 500-millisecond delivery (top 30% of all sites) is a relatively big deal in the waterfall means this page is slim and trim in terms of content.
In all, the total page load time is less than 1 second. For a typical web page, a sub-1 second is a pipe dream. That’s Google-level performance. But for a spartan page within a SaaS app, ridiculously fast load time really ought to be the norm.
Let’s see why it’s NOT the norm for this page everywhere in the world.
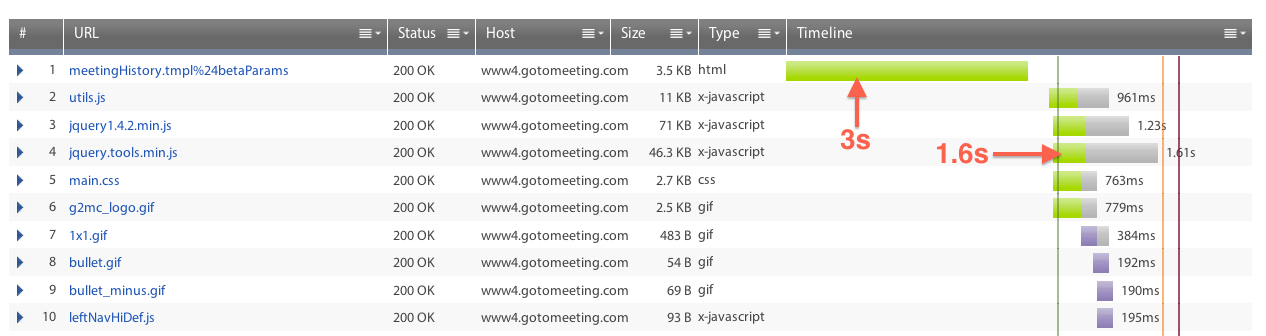
This is a waterfall from a Singapore sample. At first glance, it looks remarkably similar to the faster San Francisco sample, but a closer view reveals that the times have all ballooned. The HTML delivery takes almost 3 seconds, and the JavaScript files that took roughly 100 milliseconds in San Francisco now take almost 1 second, and the worst of them takes 1.6 seconds. This is a case where geography is everything. The similar-looking charts mean no major variables have been introduced, it’s simply a question of the same data traveling a further distance. For a SaaS application that is used globally, such high geographic variability is not good. Waiting 5 seconds for a page to load while you’re in the midst of your workflow within an app is a poor user experience.
Example 2
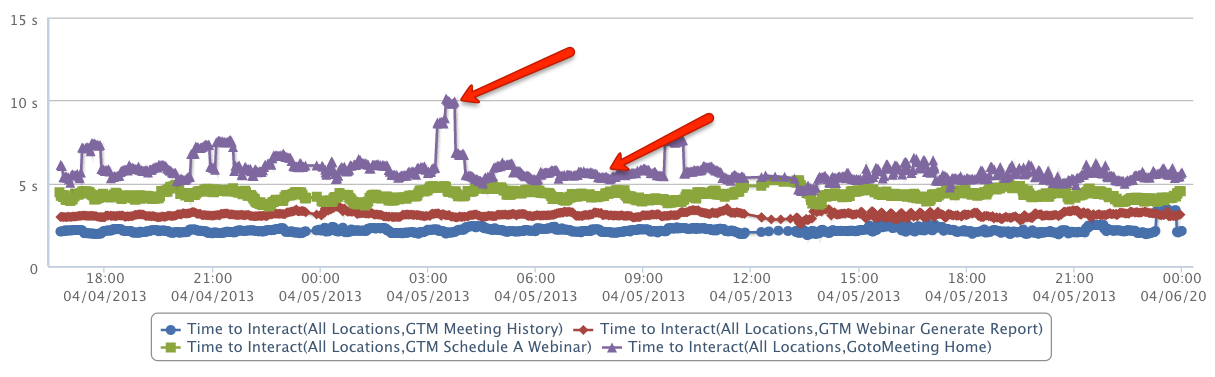
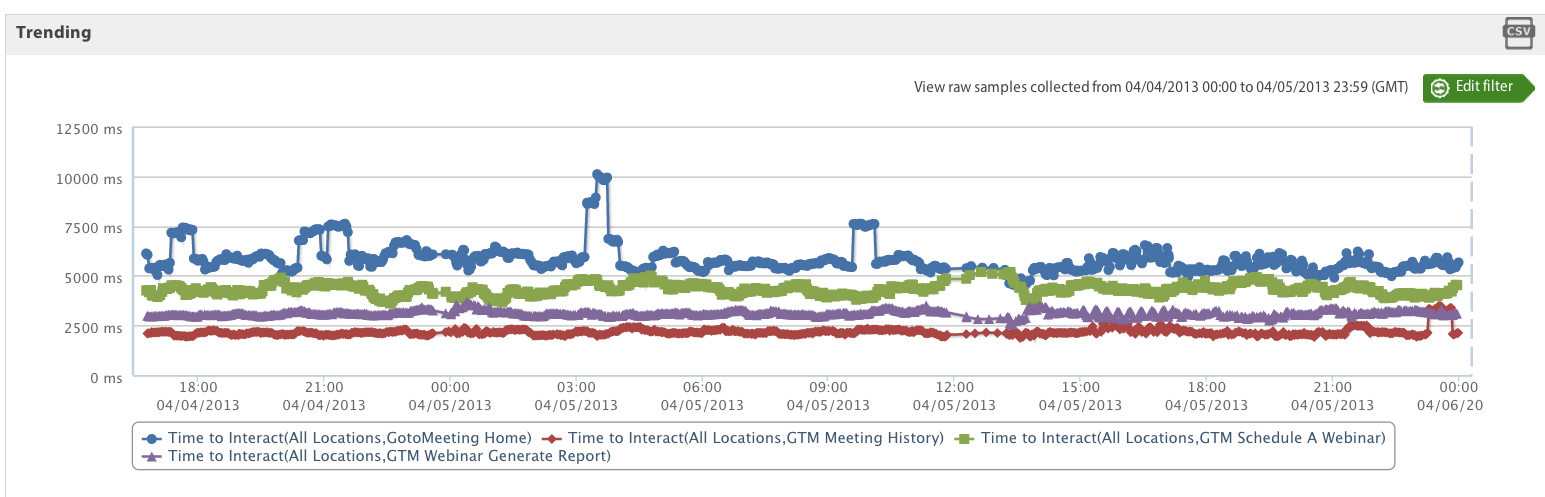
This trending graph shows four different pages within GoToMeeting, with performance averaged across all geographic locations. The blue line (the best-performing page) is the “Meeting History” the page we examined above. The purple page (the worst performer) is the home page that a user lands on when he or she first logs into the app. What makes the home page worse?
For one, it’s not the weight of the page content or the number of requests. This is usually one of the more reliable indicators of page performance: more weight and more requests lead to longer page loads. But with the exception of the ultra-lean “Meeting History” page, all four of the pages we tested are roughly the same regarding content: around 35 requests, and around 250 KB of page weight. Yet they are not the exact same performance.
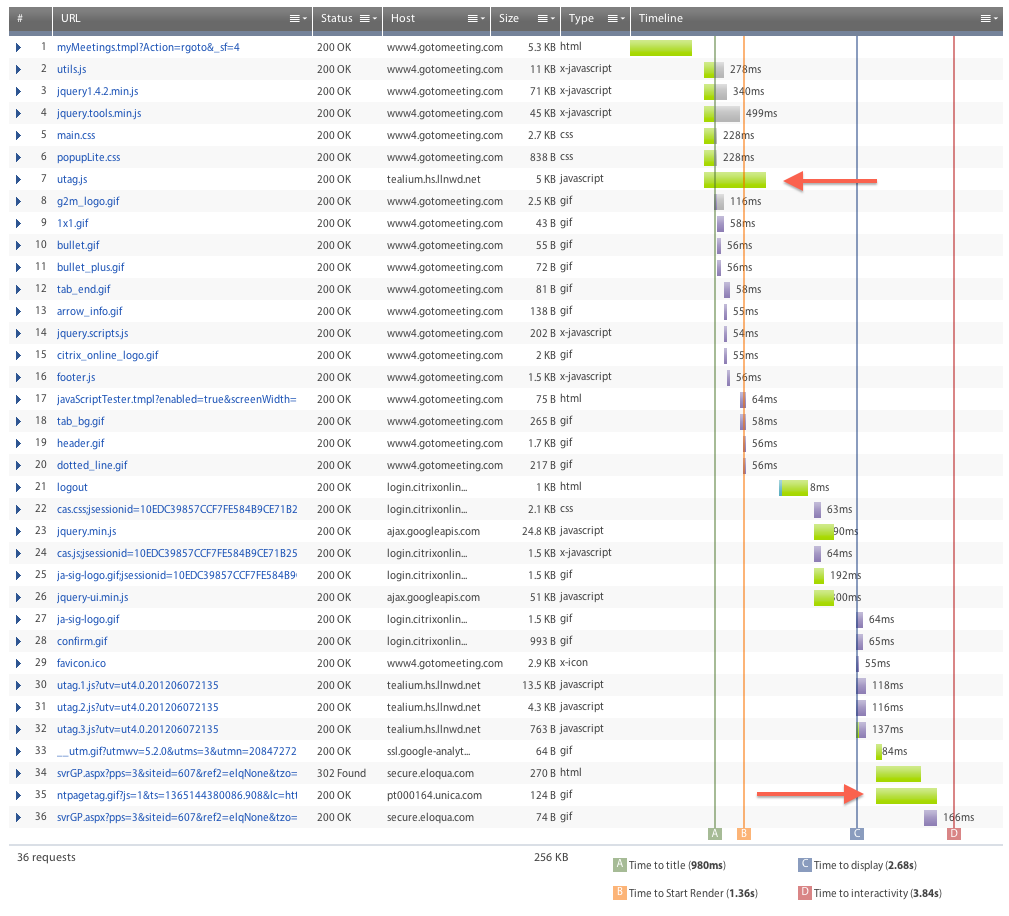
First, we’ll look at a sample of when the home page is behaving at its best (indicated by the red arrow on the right in the trending graph). Looking first at the longest bars in the waterfall, assets #7 and #34-35, we notice the host providing these assets is NOT GoToMeeting.com or Citrix. It’s third parties.
In particular, the #34 and #35 assets are holding the page back from reaching Time to Interact for over half a second. The assets in question are part of marketing software, the .gif image in question is a single pixel that doesn’t display anything to the user. And yet it’s dragging the site down.
The rest of the page performs pretty well.
Now let’s look at the sample from the big spike in load time (arrow on the left in the trending chart).
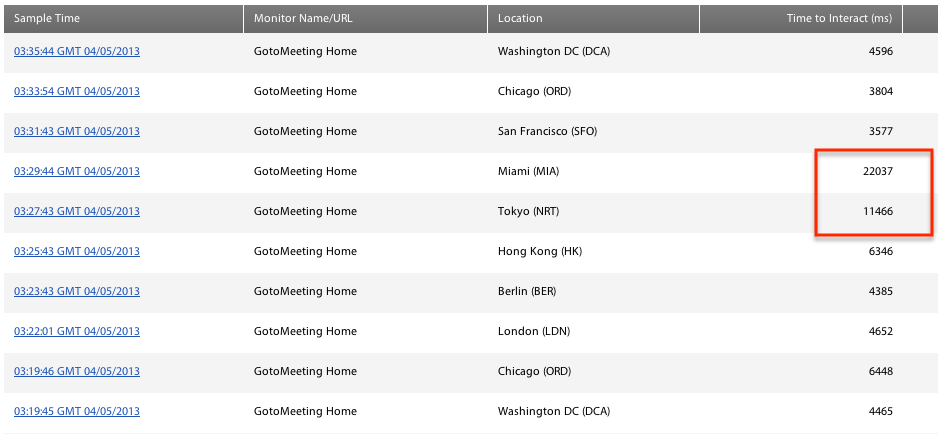
By looking at raw samples, we found that the reason the home page is consistently worse than others in the trending view is not that the page is always slow, it’s that frequent deviations from baseline performance pull up the averages. These are samples that take 10, 12, or even 20 seconds, and they occur frequently enough to affect the site’s hourly performance. This phenomenon is not present on the other three pages.
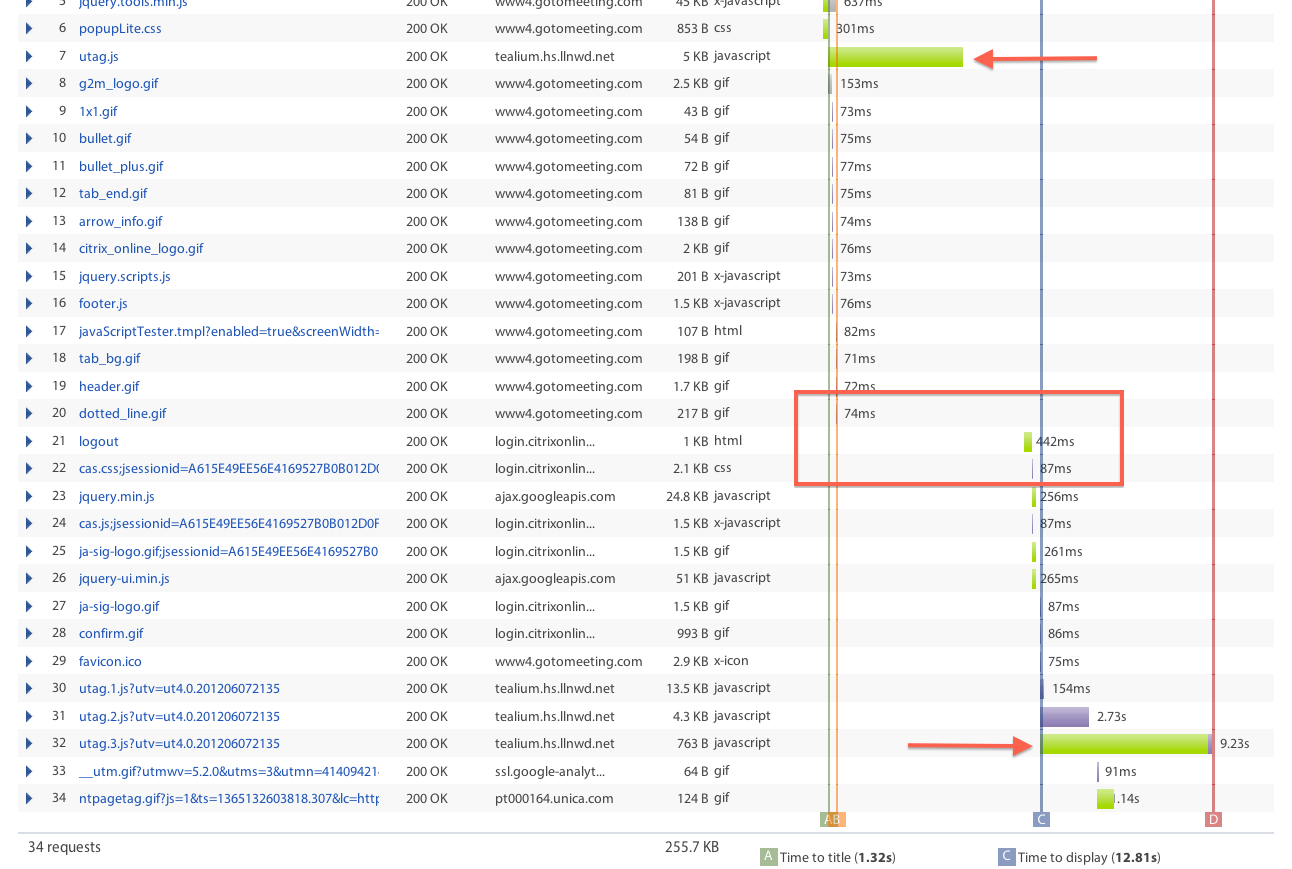
The sample shown above is an especially slow one, and it reveals why the home page is the victim of such frequent performance issues. Remember how in the last sample third-party scripts were the main perpetrators of slowdowns? Here it’s the same story, but this time they bring the page down to unusable levels. And it’s actually a different set of third-party assets. A tag management service first has issues in asset #7 that block a number of assets from completing further down (note the gap from #20 to #21). Then, another asset from the same hostname has issues at the end of the waterfall, with a single asset taking 10 seconds to complete.
The bottom line: this page is suffering from the inconsistency brought by third-party assets. Even when the page is performing at normal levels, third parties are slowing it down; and when the third parties have issues the site becomes unusable. As a SaaS provider, you probably use similar third-party services, it’s absolutely essential for good performance to keep track of those assets and set performance SLAs with the providers.
Dive into your app
To recap, the key points for SaaS monitoring:
- Set up monitors for multiple pages within your SaaS app across several variables, including geographic location, browser, and connectivity (A community plan on Yottaa Monitor is free)
- Examine charts to spot trends in performance across the variables you monitor
- Dig into the bottlenecks causing performance trends by looking into individual samples, especially the waterfall charts showing the load process of the sample