Your Yottaa ROI Calculator
Tell us about your site
Use your own numbers. Everything is editable and nothing is stored until you choose to share it.
2.5%
63% of shoppers bounce when pages take more than 4 seconds to load.
40
10
Enter $0 if you do everything in-house.
Adjust the assumptions
40%
Yottaa customers diagnose issues in minutes instead of days. Set your own expectation.
25%
Web Performance Cloud pricing is tiered by traffic. Adjust to the tier you expect.
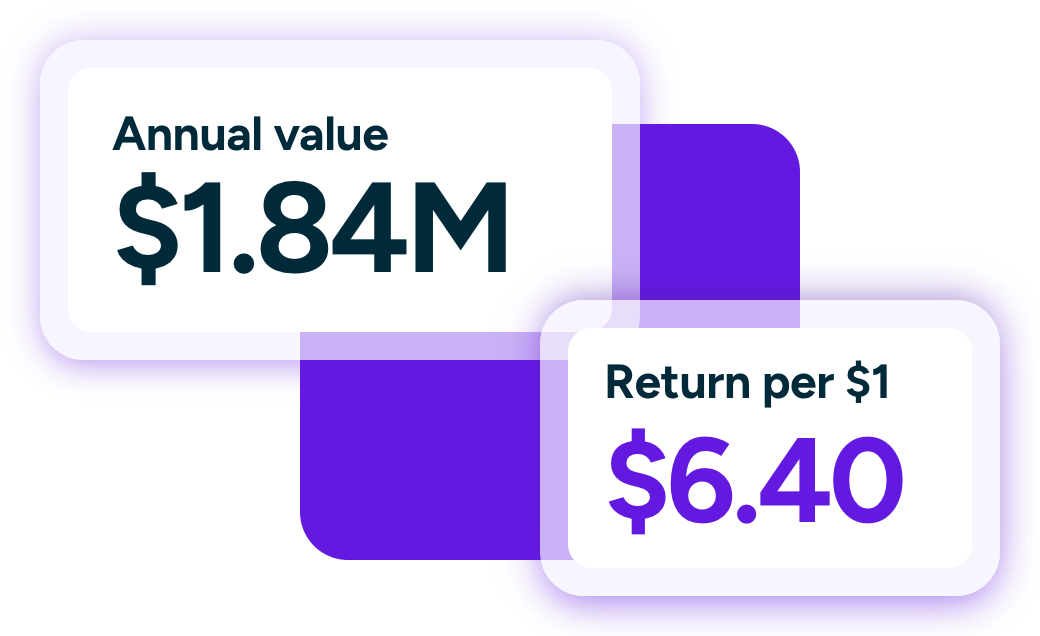
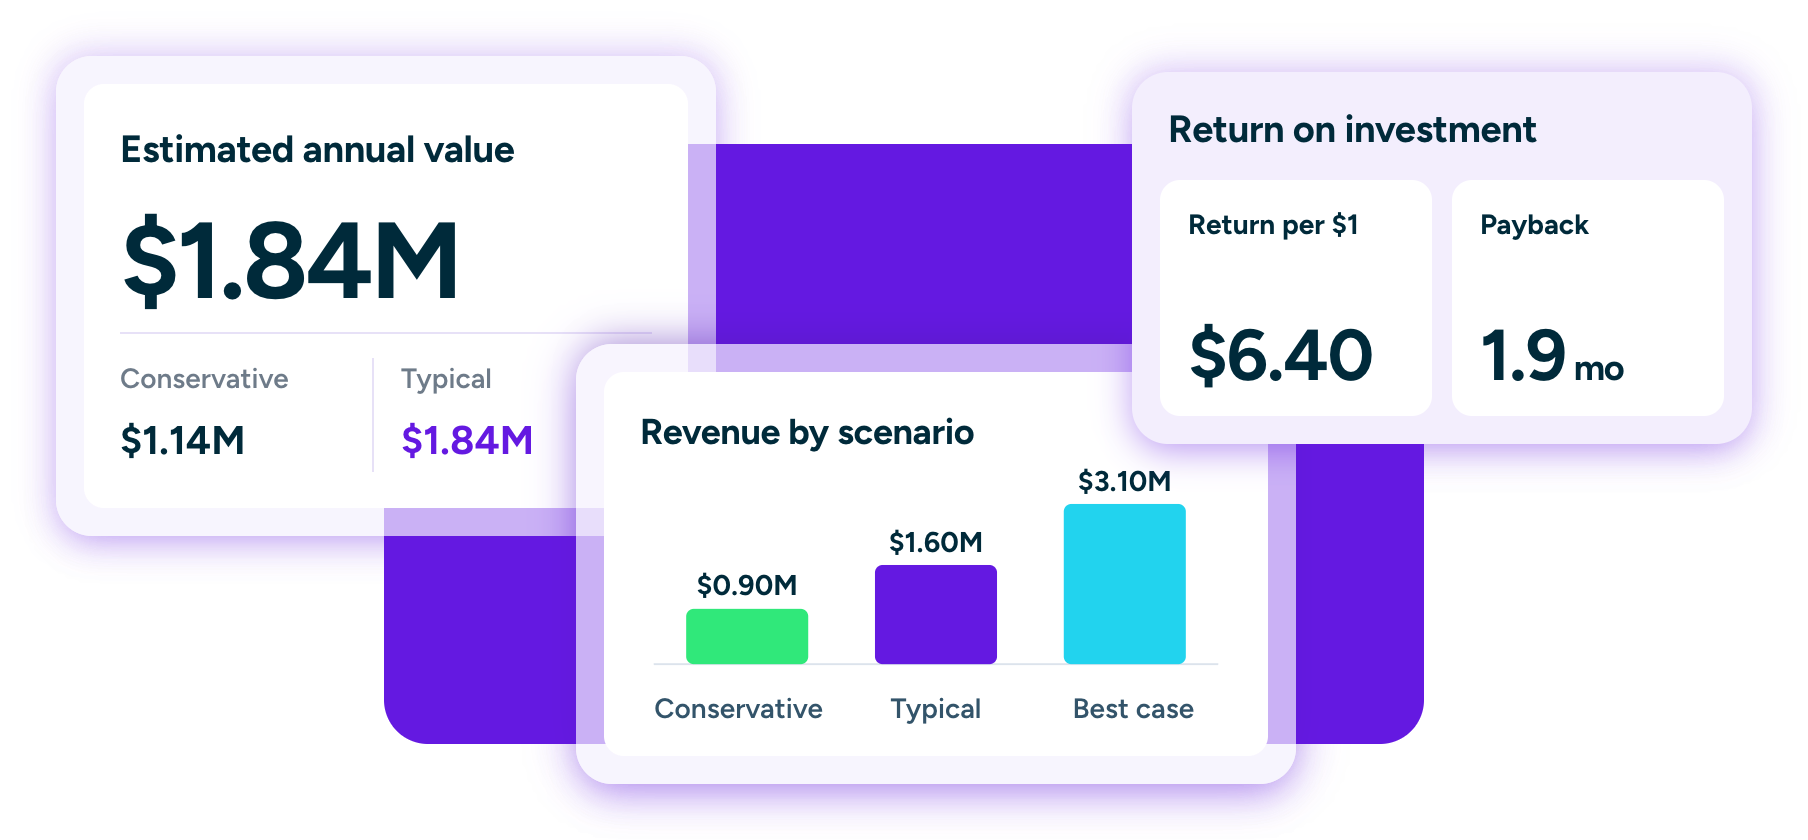
Your estimated annual value
Conservative to typical scenario, based on published Yottaa customer results and your inputs.
$—
Total estimated annual value (revenue opportunity + operational savings)
—
Estimated return per $1 invested
—
Estimated payback period
See your full breakdown
Get the line-by-line math, scenario ranges, and a printable summary you can share with your team.
Revenue opportunity
| Conservative scenario ( conversion lift) | |
| Typical scenario ( conversion lift) | |
| Best case ( conversion lift) |
Operational savings
| Engineering time recovered () | |
| Agency spend reduction () | |
| Total operational savings |
Return on investment
| Total estimated annual value (conservative – typical) | |
| Estimated annual Yottaa investment | |
| Net annual value (typical scenario) |
Get the performance brief commerce teams will actually read.
Industry benchmarks, third-party performance reports, and monthly insights to fuel your growth. No login, no spam.
Ready to get started with Rapid? GET A QUOTE