Web performance that converts. Welcome to Rapid.
Rapid is the insights and optimization solution for eCommerce websites. It combines browser-to-origin monitoring with AI-powered recommendations and built-in optimization controls — so your team turns insights into high-impact actions, instead of drowning in dashboards.


Diagnose performance issues in minutes, not days.

Catch problems before shoppers feel them.

Stop losing engineering hours to firefighting.
The rapid difference
Most tools tell you what happened. Rapid tells you what to do.
eCommerce performance teams today are stretched thin. Data is stored in disparate systems, bandwidth is limited, and it’s rarely clear which actions will drive the best outcomes.
Rapid is purpose-built for that reality. It unifies the data, surfaces what matters, and gives you the controls to act without opening a ticket for every change or relying on expensive external resources.
Three reinforcing layers, one closed loop

01 Unified visibility
Browser, edge, and origin metrics come together in one correlated model. Captures 100% of shopper sessions.

02 AI-powered recommendations
Anomaly Detection, Conversion Zone analysis, and our YoBot AI assistant turn signal into prescriptive next steps. Native MCP access makes the same data available to your proprietary AI development workflows.

03 Built-in optimization
Application Sequencing and Context Intelligence let you change how the site loads — third-party load order, device-specific rules, geo-aware delivery — without code changes.
01 Visibility
RUM + SYNTHETIC + Crux
See the full path, not just the browser.
Traditional RUM misses 15–30% of your traffic, including ad blockers, privacy tools, failed beacons. Yottaa RUM combines client-side telemetry with edge network intelligence to capture every session, validate browser data with edge ground truth, and attribute latency to the layer where it actually lives so you don’t waste cycles trying to solve problems in the wrong place.
What you get
- Insights across the delivery path
Browser, edge, and origin telemetry unified in one correlated model. - 100% traffic coverage—including known bots
Captures the 15–30% of traffic browser-only tools miss, including blocked beacons, failed sessions, and bot agents broken down by category. - Resource-level diagnostics
Element-level attribution for Core Web Vitals. Identifies the exact DOM components contributing to slowdowns. - Edge intelligence
Surfaces CDN edge time, origin time, cache hit ratio, and efficiency score per page type and geography.
Why it Matters
Browser-only RUM and synthetic monitoring only give you half the picture. When a regression hits, your team spends the morning guessing whether the problem is in the browser, at the edge, or at origin. Yottaa RUM puts all the pieces together to remove the guesswork and help you improve performance faster.
Core Web Vitals Diagnostics
Real-user field data that actually tells you how to improve
Google grades search ranking on Core Web Vitals — but their CrUX data is a 28-day moving average from Chrome users. Rapid captures CWV in real time from every browser, every device, every session, and shows you the exact resources pulling each score down.
What you get
- Trend rollups
Hourly, Daily, Weekly, Monthly rollups. Track regressions back to the release that introduced them. - Statistical flexibility
75th percentile by default (Google’s threshold), plus Average, Median, 85th, 90th, 95th. Filter by device, browser, page category. - Element-level diagnostics
For LCP: render time, load order, and triggering events. For CLS: vertical, horizontal, and area shift sources. For INP: the slowest interaction handlers. - Field data, not lab data
Real-user data for LCP, INP, and CLS, captured in real time without sampling. Up to 13 months of historical retention.
Community Benchmarking
Know where you actually stand.
Performance is relative. A 2.5-second LCP is great in furniture but middling in apparel. Rapid benchmarks your site against thousands of top commerce brands across 18 community categories and 6 major eComm platforms, so you know whether to invest in optimization or move on to the next priority.
What you get
- Third-Party Knowledge Base
PIR (Performance Impact Rating) scores for 1,000+ characterized third-party apps. Compiled from 12+ years of observing third parties and understanding how much performance drag they cause on your site. - 6 platform cohorts
Adobe Commerce, Salesforce Commerce Cloud, SAP Hybris, Shopify, Sitecore, and home grown solutions. - 18 eCommerce verticals
Apparel, electronics, food & beverage, footwear, health & beauty, home, jewelry, and more. - Cross-industry comparisons
Conversion rate, bounce rate, session depth, page load, Core Web Vitals, third-party violations—all broken down by industry so you can see how you compare against your peers.


02 AI recommendations
Anomaly Detection
Catch problems before shoppers feel them.
Anomaly Detection intelligently tracks your site against a rolling two-week baseline and flag anything outside its usual pattern — page load spikes, error surges, third-party regressions, traffic shifts. Alerts come through dashboard, email, or Slack. The result? Most fires get put out before a shopper ever notices.
How it works
- Priority scoring: Each anomaly gets High or Medium priority based on a multi-algorithm calculation, with breakout detection for sustained deviations.
- Baseline changes: Detects and flags when “normal” has shifted due to a deployment, vendor change, or a content update.
- Threshold tests: Configurable upper and lower bounds for non-periodic metrics.
What it Watches
- Page load metrics (first byte, LCP, CLS, INP, on-load, hero image display).
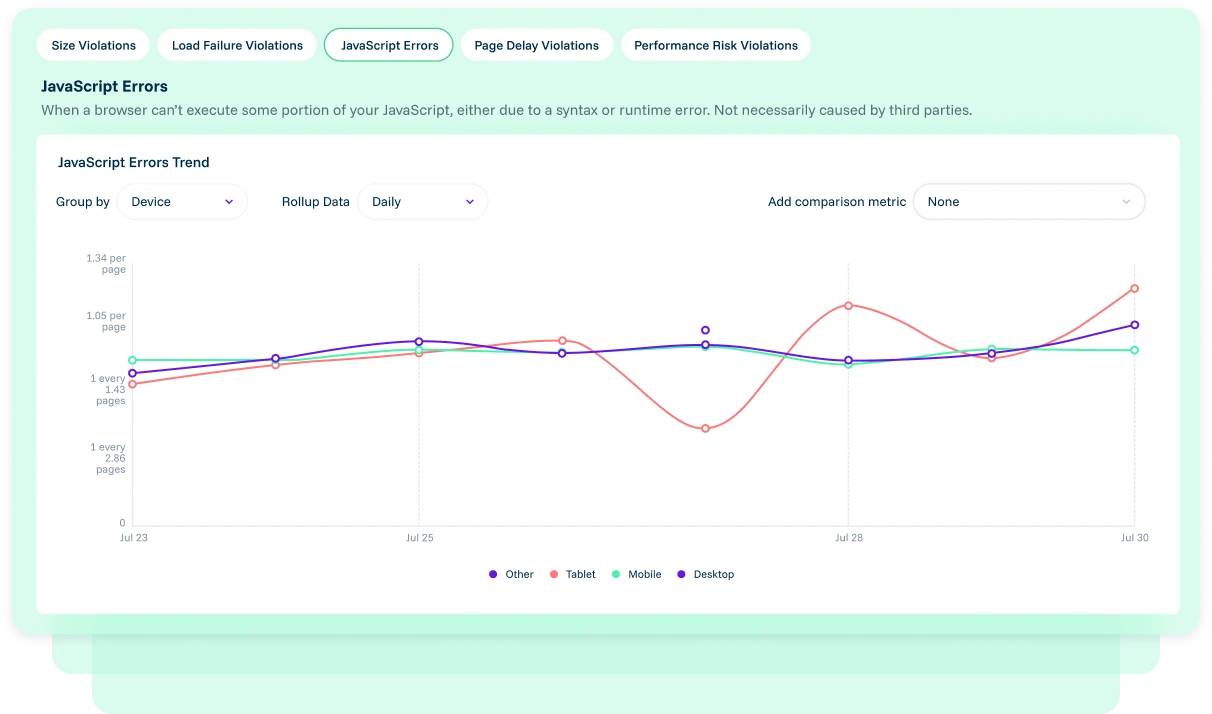
- Third-party and JavaScript metrics (resource count, JS errors, load failures, security violations).
- Traffic and edge security metrics (pageviews, response codes, WAF activity).
Real-world Example
On Black Friday, an analytics provider’s beacon started causing 5-second timeouts across multiple Yottaa customers. Anomaly Detection flagged the regression and our team deployed a sequencing rule to make the script non-blocking before most teams noticed.
Conversion Insights
Find the speed range where revenue actually compounds.
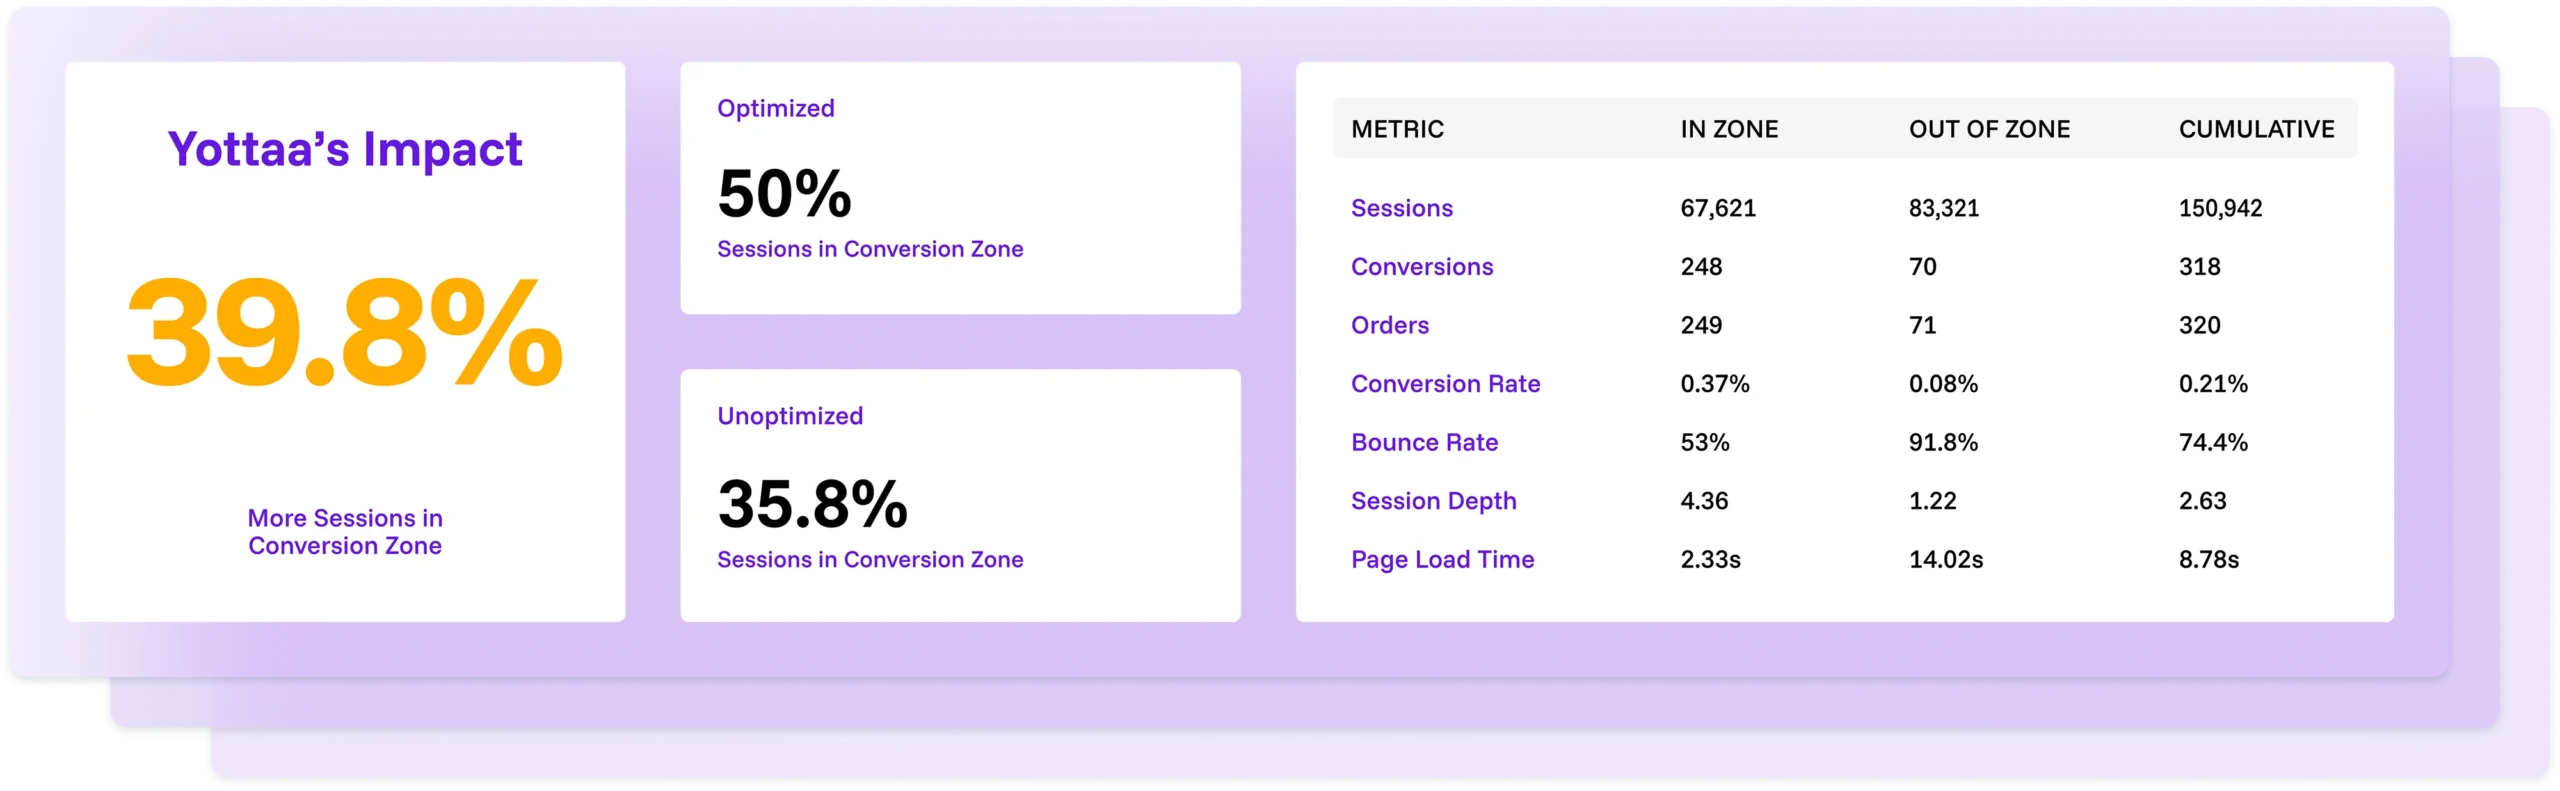
There’s a specific load time range on every eCommerce site where shopper conversion rate spikes..and it’s all downhill from there. Yottaa Conversion Insights identifies that Conversion Zone for your site, quantifies how many shopper sessions currently fall inside it, and highlights your opportunities to improve.
What you get
- Your Conversion Zone
The page load range where 60%+ of your conversions happen and conversion rate peaks. Different for every site, every device, every page category. - Optimization Impact
Compares optimized vs unoptimized traffic to quantify Yottaa’s lift in conversions, revenue, and AOV. - Known bot filtering: Filter out non-malicious crawlers from Google, Bing, and Facebook so business metrics reflect real shoppers.
- Analytics integrations
Native integration with GA4, Adobe Analytics, and Shopify Analytics. No manual instrumentation required.
YoBot AI Assistant
Ask, don’t dig.
YoBot, Rapid’s AI assistant, answers questions about your site’s performance in plain English, and is grounded in real shopper telemetry. Available in dashboard and Slack. Authenticated and scoped — it sees your data, never PII, and is always there to give you the quick, personalized answers you need to keep performance flowing.
What YoBot does
- Your answers in plain English
“What’s slowing my PDP today?” “Which third party is hurting LCP on mobile in Canada?” YoBot answers you in seconds, no technical jargon required. - Slack-native alerts
Anomaly notifications and performance reports delivered conversationally in the workspaces you’re already using. - On-demand reports
YoBot surfaces recent anomalies, trends, and performance reports for onload, first byte, last byte, page views, filtered by the past hour, 24 hours, or 30 days. - Grounded in source docs
Citations point back to Yottaa documentation so technical readers can verify the reasoning and have confidence in the outputs.
MCP Server
Performance data, native to your AI workflow.
Yottaa’s MCP server is the only one on the market that connects eCommerce web performance data directly to business impact. Ten purpose-built tools expose real-user metrics, anomalies, third-party impact, and Conversion Zone analytics to any MCP-compatible client: Claude Code, Cursor, Claude Desktop, VS Code, or custom agents.
What you get
- Data Hub architecture
Streams RUM data through Kafka into Databricks for volume, advanced analytics, and AI model training. REST APIs available alongside MCP. - Zero-install
Remote cloud-hosted server. Zero install, no local binaries. JWT auth, multi-tenant. Configuration is a single JSON entry and you’re good to go. - Critical metrics, your way
We pipe the metrics that matter right to your own agents, including session analytics, pageview analytics, time-series trends, conversion zone analytics, site anomalies, third-party impact, and JavaScript error diagnostics. - 7 segmentation dimensions
Device, browser, page category, page type, cache status, continent, country. Statistical percentiles from 50th to 95th.


03 Optimization
Application Sequencing
Every third-party tag, ranked and sequenced.
Most storefronts run 25–40 third-party apps (or more). Application Sequencing scores each one, controls when and how it loads, and defers the ones that are costing you conversion.
Sequencing rule types
- Block Resource
Turn a third party off instantly, no storefront release required. - Dynamic prioritization
Critical / High / Medium / Low priority groups; configurable spread to throttle simultaneous loads even when one vendor is slow. - Chaining
Preserve dependency order across libraries (Lodash before Axios before custom scripts). - Event-driven
Trigger loading from any UI event or external Pub/Sub message. - Lazy Load
Hold scripts until the element they support comes into view — product reviews load when the shopper scrolls there. - After Onload
Defer tags a specified number of milliseconds after the onload browser event. - After First Interaction
Load tags only after a real shopper clicks, scrolls, types, or moves the mouse.
Set your rules once, and start seeing the impact that faster load times can make on your conversion rates. No hassle, no time wasted. Just better outcomes for your digital store.
Split Testing
Assign a percentage of traffic to any sequencing rule, security rule, or third-party configuration. Feed results back into Adobe, Google Analytics, or any analytics platform. Decide whether vendor A or vendor B actually wins based on real-shopper performance data, not vendor claims.
Context Intelligence
Site Delivery, Tailored to Your Shoppers
A shopper on 5G in Manhattan and a shopper on 3G in rural Idaho don’t need the same payload. Context Intelligence analyzes each HTTP request — device, geo, browser, connection, custom properties — and adapts delivery to fit.
Context dimensions
- Page context
Full URL, pathname, parameters, page title, color depth, screen resolution. - Geolocation
Country, region, city, metro, latitude/longitude. - Browser
Chrome, Safari, Firefox, Edge, other. - Device
Desktop, tablet, mobile.
Third-Party Violations & JS Errors
The accountability your vendor contracts forgot to include.
Reviews, chatbots, recommendations, ratings — every third party your team added to grow conversion is also a potential drag. Rapid tracks every script against five violation categories, in real time, so you know which vendors are pulling their weight (and which ones are slowing you down).
Violation categories
- Security Violations Resources loading over HTTP instead of HTTPS.
- Load Failure Violations Third parties that fail to load entirely. Ad blockers, network outages, vendor outages.
- Performance Risk Violations Resources loading after onload that take longer than 1,500ms (configurable). Don’t affect page load but block reviews, chat, and recommendations.
- Size Violations Resources larger than 1MB (configurable) — usually images.
- Page Delay Violations Resource loading before onload that takes longer than 750ms (configurable).


“After a short proof of concept with YOTTAA, we saw our average site speed improve by over 30%. We also saw a strong correlation between faster site speed and higher conversions.”
Jay Nigrelli, VP of eCommerce, Perry Ellis International
 Perry Ellis
CUSTOMER IMPACT
What it looks like in production.
Performance issues diagnosed in minutes, not days. Problems caught proactively, before shoppers feel them. Less engineering time lost to firefighting. Smarter spend on agencies and external consultants.
Strategic Impact

A consistently faster, more reliable site that holds up under peak traffic.

A shared definition of “good performance” across technical and commercial teams.

Cross-industry benchmarks that tell teams where they actually stand.

Performance becomes a continuous, cross-functional program — not a siloed, one-off project.
BUILT FOR COMMERCE, BUILT TO SCALE
The foundation under Rapid.
Rapid runs on Fastly’s global edge network and is equipped to effectively manage your traffic through Cyber 5 and peak events. 1,500+ commerce sites trust it with millions of weekly pageviews.






Architecture
Data Lakehouse
RUM data streams through Kafka into Databricks for volume, advanced analytics, custom reporting, and AI model training.
Data Hub
Centralized performance data exposed through REST APIs and the MCP server for diagnostics, anomaly detection, and enterprise AI integration.
Implementation
A single tag for client-side metrics with browser-specific polyfills. Fastly real-time log streaming for authoritative request data. Designed to onboard additional CDNs.
Privacy & security
RUM data contains no PII. ISO 27001:2022 certified. GDPR and CCPA compliant. AES-256 encryption at rest.
Data retention
Up to 13 months of historical data depending on package.
Get the performance brief commerce teams will actually read.
Industry benchmarks, third-party performance reports, and monthly insights to fuel your growth. No login, no spam.
Ready to get started with Rapid? GET A QUOTE